Colorado: $12.3B in Legal Cannabis Sales in 7 Years
Coexisting Cannabis Markets: The Interplay of Medical Versus Adult Sales
March 29, 2022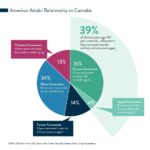
Survey: More Americans Than Not Have Consumed Cannabis
April 12, 2022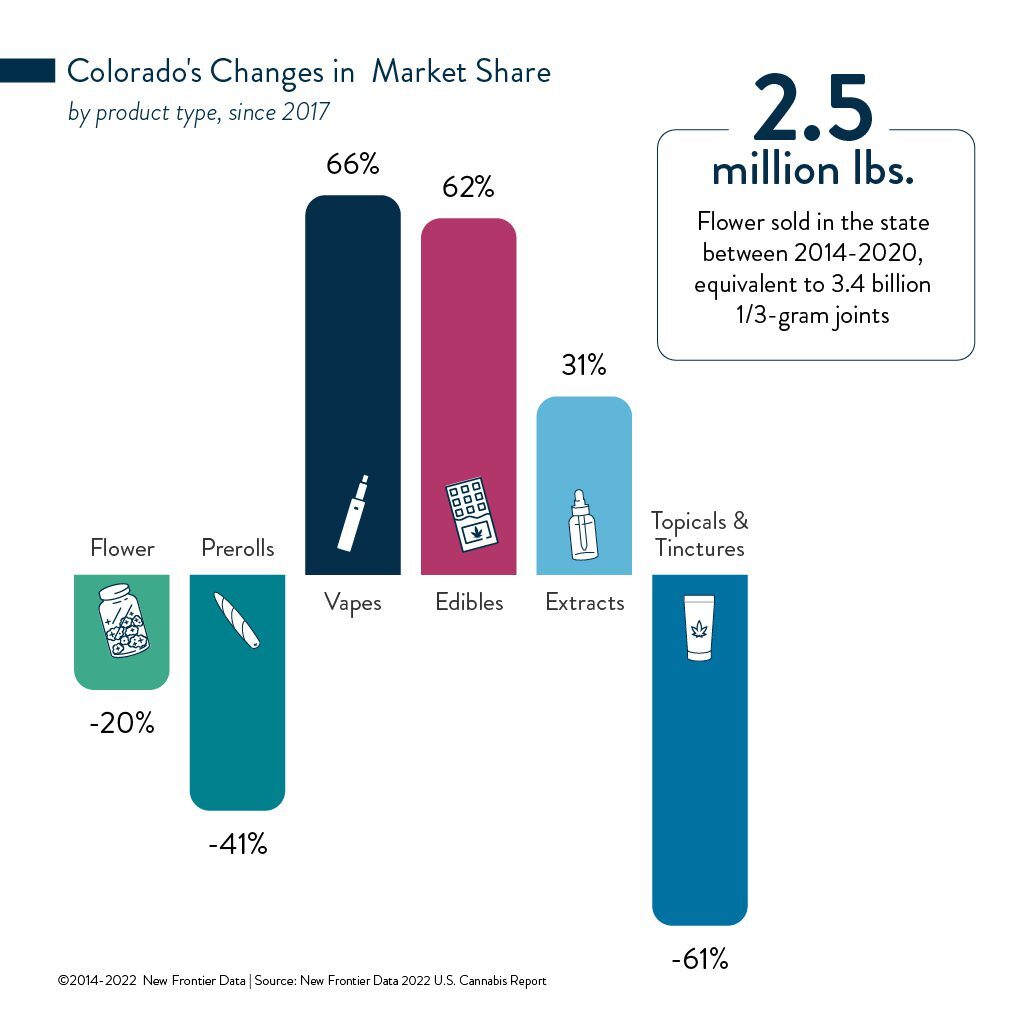
By John Kagia, Chief Knowledge Officer, New Frontier Data
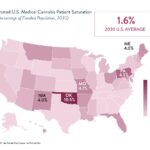
New Frontier Data’s latest offering, the 2022 U.S. Cannabis Report: Industry Projections & Trends, comprehensively analyzes the growth and early maturation of legal markets nationwide. As of April, 19 states (and Washington, D.C.) offer high-THC cannabis through legal sales for adult use, and 39 (including D.C.) make high-THC cannabis legally available for medical use.
Though more limited reforms are likely to be implemented in the near term, especially banking reforms to enable the cannabis industry to fully participate in the national and global financial markets, the low likelihood of sweeping national decriminalization will perpetuate the current patchwork of state models for the foreseeable future.
Examining Colorado’s Efforts
As an example, since Colorado began its sanctioned cannabis sales in 2014, more than $12.3 billion worth has been sold in the Centennial State. Consequently, the state has collected over $2 billion to fund various projects statewide, from allocations for its general fund, to a school capital construction fund, and law enforcement.
Colorado’s Marijuana Enforcement Division’s annual report continues to provide illuminating insights into the country’s most mature legal cannabis market.
Between 2014 and 2020, Colorado sold 2.5 million pounds of flower, or the equivalent of 3.4 billion one-third gram joints. Loose flower remains the largest product category, though its share of the market has fallen 20% percent (from 50% in 2017, to 40% in 2021). Over the same period, all other categories (except prerolls and topicals/tinctures) gained market share: Vapes are up 66%, edibles by 62%, and extracts by 31%. It is worth noting that despite any disparities in shares, revenues earned in each product category have increased across the board (based on annual growth in overall consumer spending).
Since 2014, the total number of cannabis business licenses has increased 21% (from 2,249 to 2,727). During that period, medical licenses decreased by 21% while adult-use licenses increased by 94%. Nevertheless, the relatively sustained number of medical licenses reflects some strong continued participation by medical cannabis patients in the state, even as adult-use demand continues to drive most sales in the state. For more comprehensive and specific data and analysis, visit New Frontier Data’s online business intelligence portal Equio® to gain additional insights available within the U.S. Market Dashboard.
Adult-use manufacturing facilities in Colorado have grown faster than any other license category, fueled in large part by strong demand for noncombustible consumer products. Adult-use retail (+87%) and cultivation facility licenses (+78%) have also grown significantly. On the medical side, only medical infused-product manufacturers have increased since 2014, rising 32%. Medical cultivators saw the steepest decline, falling 39% since 2014.
The monthly average number of plants grown in Colorado has nearly tripled since 2014, from 439,000 to 1.23 million. While the number of plants for the medical market has increased incrementally (+11%, from approximately 299,000 to 333,000), adult-use cultivation has grown nearly fivefold, from approximately 139,000 monthly to nearly 900,000 plants monthly throughout 2020.
The seasonality in Colorado’s flower sales has become more pronounced as the market has grown, with sales peaking annually in August and September before falling steeply in the winter months. Between 2014 and 2020, Colorado sold 2.5 million pounds of flower, or the equivalent of 3.4 billion one-third gram joints.
Tracking Inventory Flows
Transfer flows measure the volume of product that is produced by cultivators, pushed through the legal supply chain, and ultimately sold to end consumers. Residuals are calculated as total supply minus both sales and inventory, and include:
- Seizure or destruction of product by law enforcement;
- Wet-versus-dry weight entries (post-harvest curing and drying);
- Entry errors in the inventory’s tracking system database;
- Extraction yield inefficiencies;
- Removal of product for quality assurance purposes; and
- Supply-chain product losses.
Since launching its market, Colorado’s product transfers through the supply chain have remained quite consistent, with just less than two-thirds of products being sold to retailers, and one-third remaining in inventory by the end of the year. Each year, approximately 5% of products are unaccounted for in the supply chain, including products that are destroyed due to test failures, manufacturing malfunctions, or other issues which prevent the product from being brought to market.
Loose flower remains the largest product category, though its share of market has fallen 20% (from 50% in 2017, to 40% in 2021). Over the same period, all other categories (except prerolls and topicals/tinctures) gained share: Vapes are up 66%, edibles 62%, and extracts 31%. It is worth noting that despite changes in market share, revenues earned in each product category have increased (based on annual growth in overall consumer spending).
Since 2017, both the average consumer spending per month and the average spending per transaction have increased approximately 50%. While average monthly consumer spending was on a steady upward trend, 2019 and 2020 saw the two highest increases in average monthly spending. In 2019, average monthly spending increased 26%, while in 2020 it jumped another 19%. The start of the COVID-19 pandemic also led to a sharp increase in average spending per transaction, which jumped 24% from $71/transaction in 2019, to $88 in 2020.
Data tracked by the state also shows the average retail costs of different product categories. These data reveal some notable differences among types of concentrates, as well as between medical and adult-use markets. In the adult-use market, a gram of resin was the most expensive of the concentrate categories (retailing for $23.11), with hash ($22.52) and oil (22.23) being the second- and third-most expensive items, respectively (The state does not make a distinction between distillates and isolates). Shatter is the least-expensive concentrate, priced at $14.54.
On average, concentrates were 29% more expensive in the adult-use market than in the medical one, with vape cartridges (+74%) and hash (+58%) having the greatest price differentials between the two markets. The significantly higher prices in the adult-use market denote one reason why participation in Colorado’s medical market has remained strong eight years since the state’s adult-use sales began. For patients who require high doses of concentrates to manage their conditions, the cost differential between the medical and adult-use markets offers a savings that can add up quickly, based on the quantities consumed.
A Diagnosis of the Medical Market
Now eight years since adult-use sales began in Colorado, the number of registered patients in the state has fallen 22%, from a little over 111,000 to just over 86,000. A few factors are driving such sustained participation in the medical market: Medical cannabis is not subject to the state’s 15% cannabis excise tax, retail prices for medical products are (on average) significantly lower than those of the adult-use market (as shown above in the concentrate market), and medical patients with a physician’s approval are permitted to purchase beyond the state’s purchase limits, enabling high-consumption patients to benefit from economies of scale.
The trend data on product volumes consumed per patient affirm that patients who choose to remain in the medical program stand to benefit most from lower-cost products and associated savings from not having to pay the excise tax.
For a medical patient who consumes cannabis intermittently and only spends $100 to $200 per year on cannabis, cost may be a less pertinent factor in their purchase decision than either convenience of their purchase location or the quality of service at their chosen dispensary.
However, the patients annually spending either hundreds or thousands of dollars are far more likely to be price-sensitive, making them more likely to remain in the medical market to select the products and purchase sources offering lower prices.
The greatest change seen since 2014 is among average concentrate units consumed per patient per year, which have increased more than threefold (from approximately 6 units per patient to nearly 25 units). Meanwhile, flower demand more than doubled (from 0.95 pounds per patient, to more than 2.1 pounds). Edibles saw a more incremental gain, up 24% from approximately 17 units per patient to 21 units.
While smoking shows resilience as consumers’ primary means for ingesting cannabis, a generational change is anticipated as more consumers either supplement flower with non-flower products or give up smoking flower altogether. The fragmentation of the product landscape is quickly reshaping the flower-dominant segment of the market; based on what has been seen in Colorado so far, consumers who use flower exclusively are likely to become predominantly older, male, and less-frequent users.
